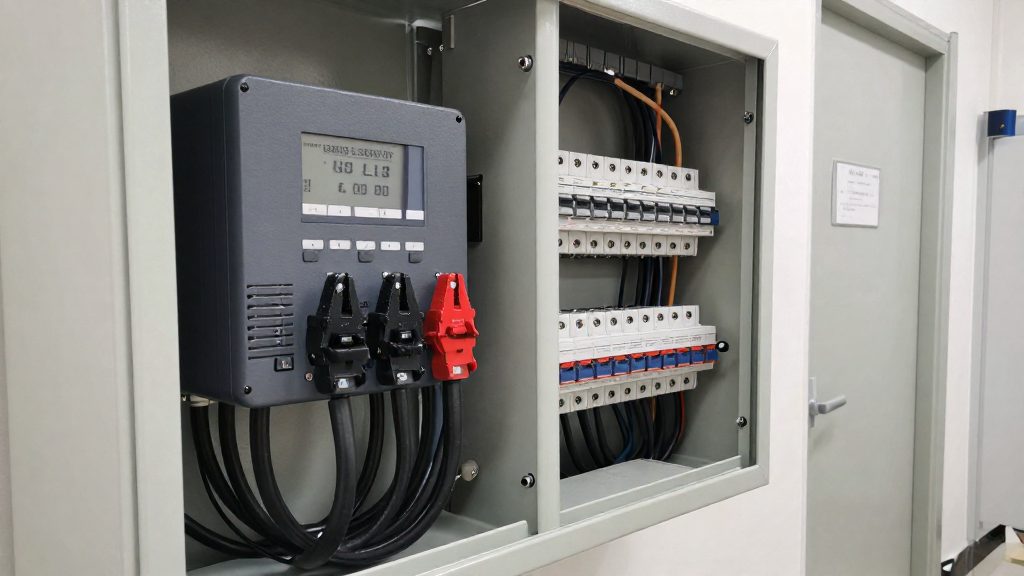
What is a whole-home energy monitor with circuit-level tracking?
A whole-home energy monitor with circuit-level tracking is a system that measures electricity for the entire house and, in its advanced form, also reports how much each individual circuit consumes. A basic monitor shows only the combined household total. A circuit-level system shows which part of that total goes to circuits such as HVAC or a water heater. According to Emporia Energy (2026), basic home energy monitors track total household electricity use, while advanced systems also monitor individual circuits.
What is a whole-home energy monitor with circuit-level tracking?
Total-household versus per-circuit monitoring
The two approaches differ in what they measure and what they can tell you.
| Monitoring level | What is measured | What it reveals |
|---|---|---|
| Total-household | Combined electricity use for the whole home | Overall consumption and how it changes over time |
| Per-circuit (circuit-level) | Electricity used by each monitored circuit | Which circuits account for part of the total |
The main-breaker clamp provides the whole-home figure. Clamps on individual breakers provide the circuit-level figures.
Typical circuits tracked
Circuit-level systems are most useful on high-demand loads. Emporia Energy (2026) names two examples: the HVAC system and a water heater. Circuits that power general appliances can also be monitored, so the readings show their share of the total.
Data granularity: what totals and circuit readings show
The main-breaker total describes the whole home’s demand. Circuit readings break that total into parts, which allows comparison between loads. Two limits apply:
- A circuit reading reflects every device on that circuit, not one appliance.
- Circuit readings that do not add up to the total leave part of the consumption unattributed.
How do CT clamps measure each circuit?
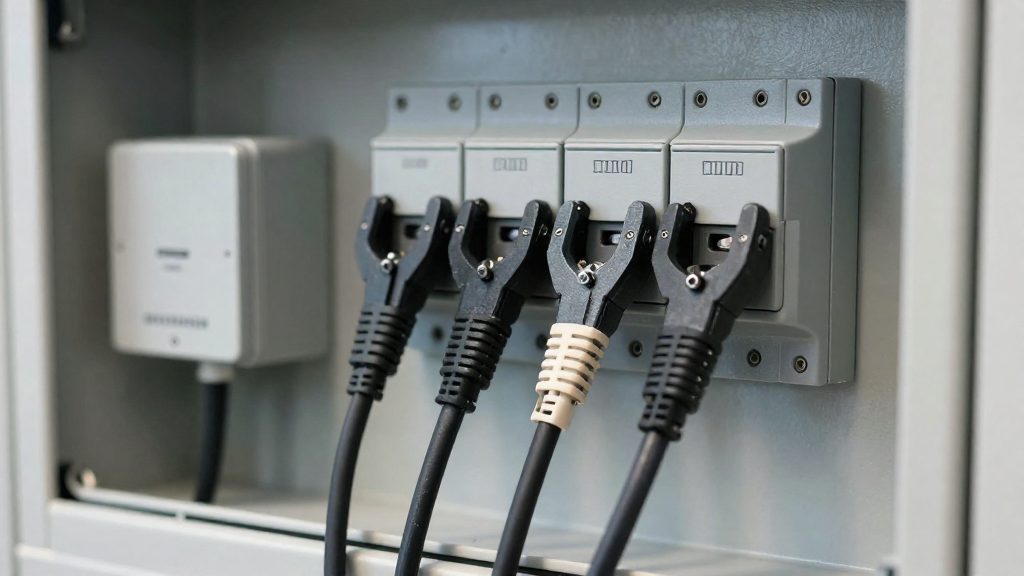
A current transformer (CT) clamp is a split-core sensor that wraps around a single insulated conductor without cutting or disconnecting it. The clamp reads the current flowing through that wire through electromagnetic induction. In a US split-phase service, the main feed has two hot legs, so whole-home measurement usually needs a clamp on each leg; check the manufacturer’s documentation. The alternating current in the conductor creates a changing magnetic field, which induces a proportional, much smaller current in the clamp’s secondary winding. The monitor’s electronics convert that signal into an amperage reading and, combined with voltage, into power and energy use.
Because the clamp only senses the magnetic field around the wire, the reading reflects the load on that conductor. This is why placement determines what the monitor reports.
Main breaker versus per-circuit clamps
Monitors use CT clamps on the main breaker, and on some systems on individual breakers. The two placements answer different questions:
| Clamp location | What it reports | Typical use |
|---|---|---|
| Main breaker | Total electricity entering the home | Whole-house consumption and the baseline for all other readings |
| Individual breaker | Current on one branch circuit | Per-appliance or per-system tracking, such as HVAC or a water heater |
Advanced systems rely on the individual-breaker clamps to show what each circuit consumes. A monitor with only a main-breaker clamp can show the total but cannot attribute it to a specific circuit.
Channel count in practice
Each clamp uses one input channel on the monitor. The example Vue installation in Emporia’s guide uses 10 CT clamps (Emporia Energy, 2026). Before buying, count the circuits you want to track, add the main-breaker clamp, and confirm the monitor supports at least that many channels.
Circuit sensors or AI detection: which is better?
Neither approach is better in every case. Circuit-level sensing measures the current on a specific breaker, so it reports what that circuit draws. Appliance disaggregation is software that estimates individual appliances from the total load measured at the main panel, using the electrical pattern each device produces when it switches on or off. Circuit sensing gives direct readings wherever a sensor is installed. Disaggregation can cover loads without a dedicated sensor, but its per-appliance figures are estimates.
Accuracy gaps when appliances share one circuit
A breaker that feeds two or more appliances produces one combined reading. A circuit sensor cannot separate those appliances, so the reading is only as specific as the wiring. Disaggregation faces the same limit in a different form. It must split one combined signal, so loads that switch on at similar times are the hardest to attribute correctly. For both methods, accuracy falls as the number of simultaneously running loads on one measurement point increases.
Which loads AI disaggregation identifies reliably
Disaggregation works best on loads with a distinct, repeatable signature: clear on and off transitions and a stable power draw during each cycle. Variable loads, or loads that run alongside others, are harder to identify. Coverage differs between software platforms, so check each vendor’s list of recognised appliances rather than assuming a load is supported.
Coverage trade-offs for multi-appliance and always-on loads
Circuit sensing needs one measurement point per circuit. Per-circuit coverage is limited by how many breakers are instrumented. Disaggregation needs no extra hardware, but it only reports appliances it can recognise.
Always-on loads draw power continuously, so they blend into the baseline of the total reading. A circuit sensor reads them directly if they have a dedicated breaker. Disaggregation may instead place them in an unidentified category.
| Criterion | Circuit sensors | AI disaggregation |
|---|---|---|
| What is measured | Current on one breaker | Total load at the panel, split by software |
| Shared-circuit loads | One combined value | Separated by inference; accuracy varies |
| Loads with distinct on/off cycles | Measured directly | Usually identified when signatures are distinct |
| Always-on loads | Measured directly if on their own breaker | Often blend into the baseline |
| Nature of per-appliance figure | Measurement | Estimate |
Emporia, Sense, IoTaWatt and Span: four approaches to circuit-level monitoring
These four monitors reach circuit-level visibility by different routes. The differences show up in three places: how many circuits you can measure, how the hardware connects to the electrical panel, and how the purchase is structured. Emporia uses clamp-based metering, Sense relies on software detection, IoTaWatt is an open-source project, and Span is a smart-panel approach. Each route suits a different installation and a different level of technical involvement.
Emporia Vue: clamp-based channel tracking
The current transformer (CT) clamp is the core of the Emporia Vue approach. The clamp count is the number to compare first, because it sets how many circuits the system can measure.
Emporia’s clamps are installed in the existing panel, but check the manufacturer’s documentation for what your panel requires.
Sense: detection-led monitoring
Sense is positioned around AI-based appliance detection. Rather than relying only on a dedicated sensor for each circuit, its software identifies devices from their power-draw patterns. Circuit-level information depends on how the hardware and software are configured for your home, so check Sense’s current product page for the supported circuit count and hardware layout before comparing it with clamp-based systems.
IoTaWatt: open-source, user-configured
IoTaWatt is an open-source energy monitor. It is aimed at users who are comfortable configuring hardware and software themselves. Its strength is flexibility: channel setup and data handling are managed by the user rather than a vendor app. Check the project’s documentation for the supported sensor types and any channel limits before ordering parts.
Span: smart-panel approach
Span is a smart-panel product. Monitoring is built into the electrical panel itself, not added as clamps alongside it. That changes the panel requirement: the decision is about a panel-level installation rather than an add-on, so the installation scope differs from the clamp route.
Comparing the purchase
Pricing varies with channel count, hardware type and installation. Compare the total cost of each option, including any electrician visit and any required hardware, not only the list price of the monitor.
How much does installation cost, and do you need an electrician?
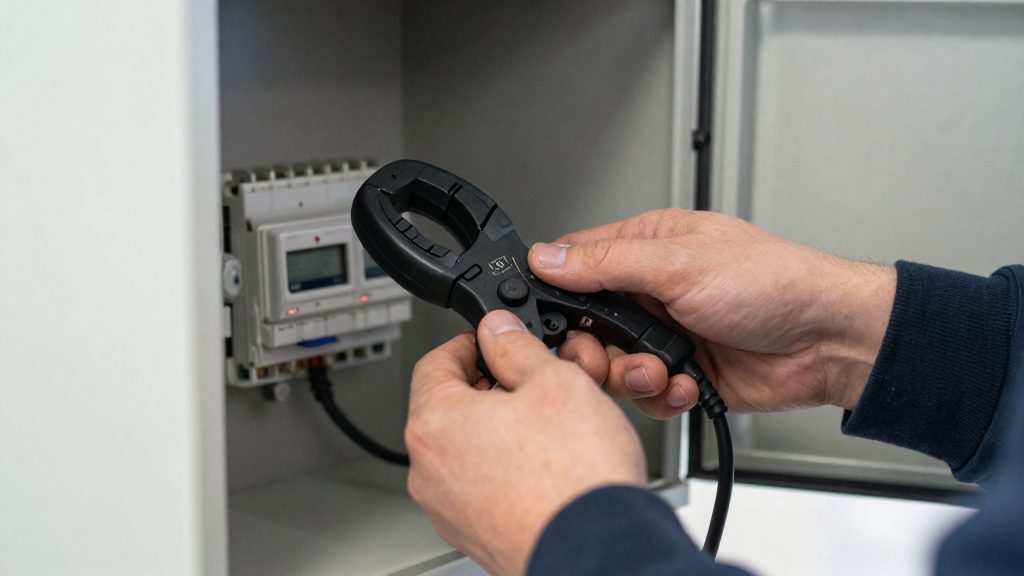
Emporia Energy says a licensed electrician typically installs its monitor in the panel in about a couple of hours. According to Emporia Energy (2026), a licensed electrician typically installs a monitor in the panel in about a couple of hours. Installation prices vary by region and by how many circuits are monitored, so request written quotes from local electricians that state the number of clamps and whether permit work is included.
Electrician time and scope
Labor time depends mostly on how many CT clamps are installed. Ask the installer which circuits they plan to monitor and whether the quote covers all of them, because a single main-breaker clamp is a smaller job than a system spread across many circuits.
Panel compatibility
Emporia says its monitor works with nearly all standard panels, but compatibility is model-specific and differs between brands, so check the manufacturer’s compatibility list for your exact panel before buying. Confirm the monitor’s required hardware and clamp sizes with the installer before the visit, so the electrician arrives with the correct parts.
Can a homeowner fit the clamps?
Clamps are installed inside the electrical panel, where the service conductors and the line side of the main breaker remain energized even with the main breaker off. Work inside a live panel carries risks of electric shock and arc flash. Unless your local rules permit homeowner electrical work and you are trained to work inside a panel, hire a licensed electrician.
Permits and inspections
Permit requirements depend on your locality. Before work starts, contact your local building or electrical inspection authority to find out whether panel work or a new monitoring device requires a permit or inspection, and ask the installer who handles that step.
Can a monitor really cut your power bill?
A whole-home energy monitor does not reduce consumption by itself. Savings depend on whether the readings change how you use electricity. Circuit-level tracking shows which loads draw power and when, which makes the changes you choose easier to target. The best-documented figure in the available sources is a vendor claim: Sense says its users save an average of 4-8% a year on energy (Sense, 2026). That range is a vendor claim, so treat it as the manufacturer’s average rather than a measured result for your home.
Total-use data tells you that consumption rose; circuit data tells you which load caused it.
Behavioral changes that drive savings
Most of the potential saving comes from habits the readings reveal:
- Scheduling heavy loads: Identify high-draw circuits, such as a water heater or an electric dryer circuit, and run them during the hours your tariff or usage pattern favors. This only works if your utility charges different rates by time of day.
- Finding standby loads: Check which circuits keep drawing power when the house is empty or at night. Devices in standby mode may appear as a steady baseline on a circuit reading.
- Confirming changes: Compare the same circuit before and after a change, such as a revised thermostat schedule, to see whether the reduction is real.
How long the payback takes
The payback period depends on three variables: the system’s installed cost, the energy it helps you save, and your electricity price. The payback period in years is calculated as: system cost / (annual kWh saved × price per kWh). Because the saved amount depends on your usage pattern and tariff structure, a figure from a vendor average cannot give you a reliable payback estimate. Use your own bills for a baseline period, then compare them after changes to get a realistic figure.
Does it work with Home Assistant and solar?
A whole home energy monitor works with Home Assistant only if it exposes its circuit readings in a form Home Assistant can read. Some monitors send data only to a vendor cloud app, which means Home Assistant needs the vendor’s API or a supported integration to access it. Others offer a local data interface on your network, which keeps readings on-site and makes them easier to use in automations. Check the manufacturer’s documentation for a Home Assistant integration, a local API, or a supported bridge before you buy, because the route determines whether your data stays local.
Integration routes
| Route | How readings reach Home Assistant | What to verify |
|---|---|---|
| Local interface | Home Assistant reads values over the home network | That the monitor documents local access and works without the vendor cloud |
| Vendor cloud API | Readings pass through the vendor’s servers first | That an API is offered, its access terms, and how often data updates |
| Vendor integration | Installed through Home Assistant’s integrations list | Which entities are created and which firmware or app versions are supported |
Solar production and grid export
A main-breaker current transformer (CT) measures net flow at the service point. Whole-home consumption can be derived from the main-breaker reading and solar output:
- Home consumption = grid import + solar production − grid export
- Self-consumed solar = solar production − grid export
Solar production is measured separately, usually on the inverter feed or a dedicated solar circuit. Grid export appears as reverse current at the main breaker. Confirm how your monitor reports direction and whether export is shown as a positive or negative value. Some systems rely on the inverter’s own integration for production data, so check whether you need both sources.
Mapping circuits to entities
- Name each channel in the monitor’s app to match the physical circuit, such as “water heater” or “HVAC.”
- Create one power entity per channel in Home Assistant, using a consistent pattern like
sensor.water_heater_power. - Build energy totals with Home Assistant’s utility meter helper, which accumulates kilowatt-hours over daily or monthly periods.
- Add dashboard cards showing live power for each channel alongside the main-breaker total.
- Write automations using thresholds, for example to notify you when a circuit draws power for an unusually long time.
Frequently asked questions
Do I need an electrician to install a circuit-level energy monitor?
Emporia Energy (2026) states that a licensed electrician typically installs its monitor in the panel in about a couple of hours, and that it works with nearly all standard panels. These are vendor statements about Emporia’s hardware, so check the manufacturer’s instructions and your local electrical rules before opening the panel.
How many current transformer clamps do I need?
The 10 current transformer (CT) clamps in Emporia’s guide describe one example installation, not a requirement. The number you need depends on how many circuits you want to track, so confirm the clamp count supported by your specific model with the manufacturer.
Does a circuit reading show what one appliance uses?
Not directly. A circuit reading totals everything connected to that circuit, so a circuit shared by several loads reports their combined draw. Any gap between the sum of your circuit readings and the main-breaker total is consumption that no monitored circuit accounts for.