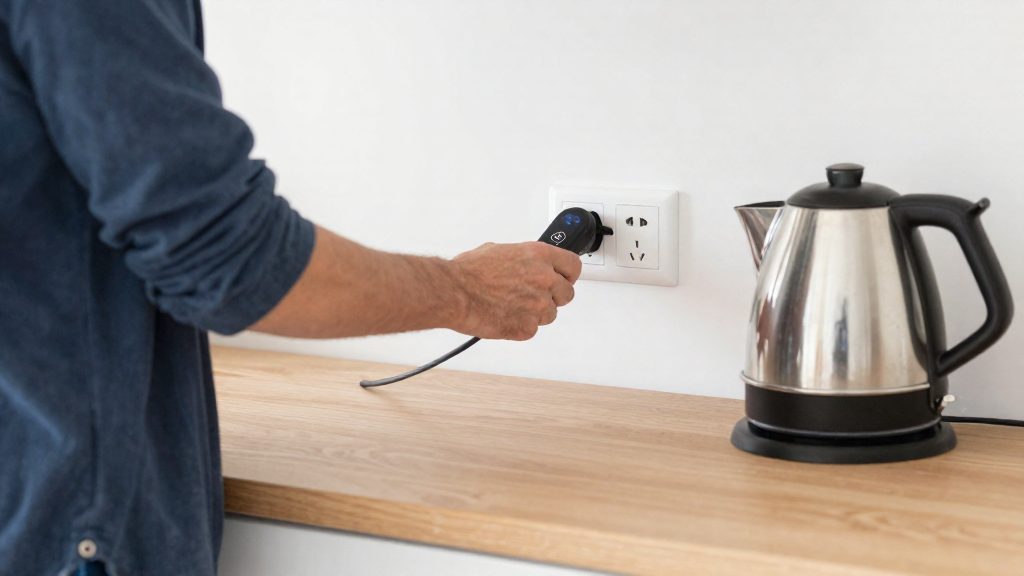
Whole-home totals show how much electricity a house uses, but not which devices cause it. Appliance-level data answers the decisions that come first: which device is worth replacing, which unexpected load is running unnoticed, and whether a change in routine actually lowers consumption. According to Online Tech Tips (2026), a free utility portal reports daily, weekly and monthly kWh, often in 15-minute or hourly intervals, but it shows overall patterns rather than the appliances behind them.
Why track electricity use by appliance?
Finding high-consumption devices worth replacing
A utility total cannot rank devices against each other. With a per-device meter, an old appliance that draws more than a similar newer one becomes measurable.
Whole-home panel monitors give a different view. Sense uses machine learning to identify appliances. Emporia Vue Gen 2 reports circuit-level data.
Spotting unexpected loads from forgotten devices
Some loads never appear on the list of things you think about. According to This Old House (2026), computers, monitors, chargers, TVs, cable boxes and printers can draw power while switched off. A whole-home total that rises overnight cannot tell you whether a charger or a cable box is responsible. A device-level reading can, which turns a suspicion into evidence.
Checking whether habit changes reduce usage
Whole-home totals mix every load together, so a habit change such as running a dryer at a different time is partly masked by everything else in the house. Per-device readings isolate the target load. Shelly monitors paired with Home Assistant store data locally rather than relying on the cloud, which makes it easier to keep a long record of one device for before-and-after comparison.
| Decision | What per-device data shows | What a whole-home total hides |
|---|---|---|
| Replace a device | Use of one device over a comparable period | Which device drives the bill |
| Find a forgotten load | Consumption outside the device’s expected use | Small loads |
| Test a habit change | Before-and-after use of the target device | The effect of the change within overall usage |
Compare like-for-like periods, such as the same weekdays, and avoid drawing conclusions from a single day.
How do you calculate appliance usage by hand?
The rated-power method estimates an appliance’s energy use from its wattage and daily run time, with no hardware. The formula is watts × hours used per day ÷ 1,000 = daily kWh. Multiply that by the number of days to get monthly kWh, then by your electricity rate to get a monthly cost. The result is an estimate, because it assumes the device draws its rated power for every hour you count.
Step 1: Find the wattage
Read the wattage from the label on the device, its power supply, or the manufacturer’s manual. If the label lists only amps and volts, multiply them (amps × volts = watts) to get the wattage.
Step 2: Count real operating hours
Count the hours the device actually runs, not the hours it stays plugged in. A device that is switched off at the wall or idle between uses should be counted only while it is drawing power for its function.
Step 3: Apply the formula
Using the worked example from Direct Energy (September 2026), a 120 W TV used 4 hours a day gives:
| Step | Calculation | Result |
|---|---|---|
| Daily energy | 120 W × 4 h ÷ 1,000 | 0.48 kWh/day |
| Monthly energy | 0.48 kWh × 30 days | 14.4 kWh/month |
| Monthly cost | 14.4 kWh × USD 0.12/kWh | about USD 1.73/month |
Step 4: Convert kWh into cost at your rate
Replace the 0.12 rate with the price per kWh shown on your utility bill. The formula is monthly kWh × price per kWh = monthly cost. Rates often include fixed charges and may vary by time of day, so the per-kWh figure on the bill gives a more accurate result than a generic rate.
Do plug-in meters and smart plugs work?
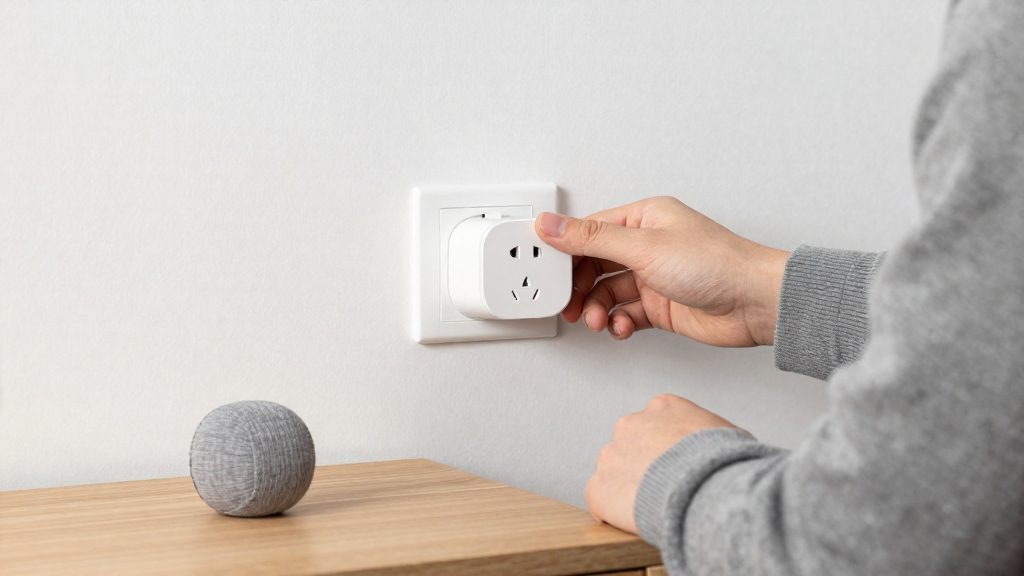
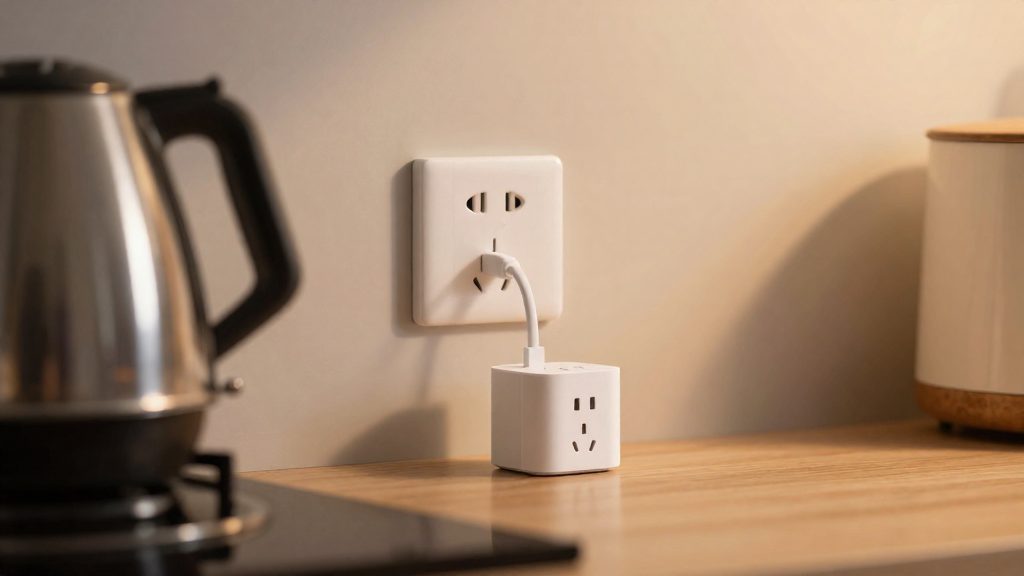
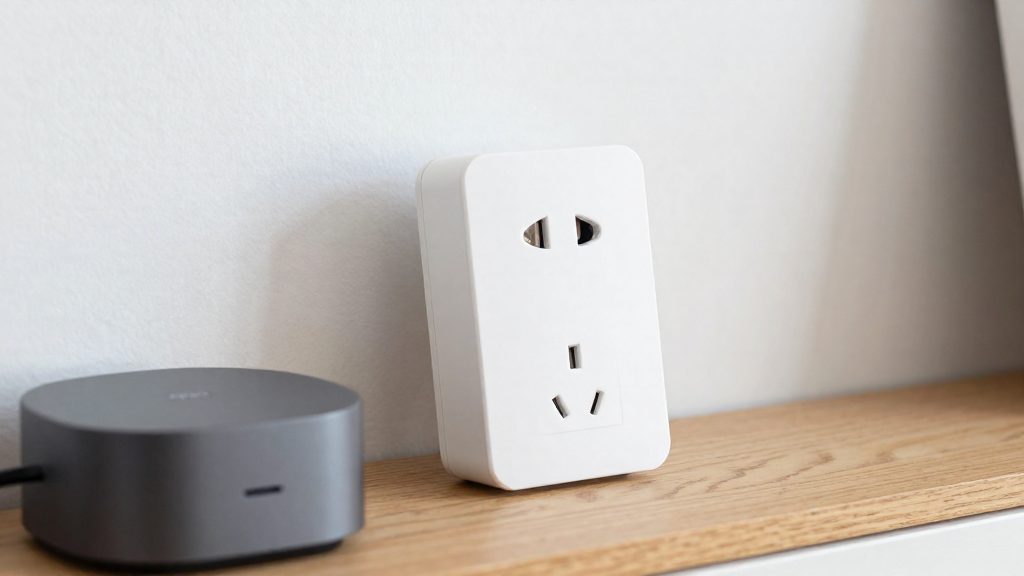
Yes, for a single device on a standard outlet. A plug-in appliance meter sits between the appliance and the outlet and shows current watts, energy use over time and estimated cost. It costs from about $10 and needs no electrician, according to This Old House (2026-06-02). An energy-monitoring smart plug connects over Wi-Fi and shows one device’s real-time energy use in an app, and it also supports on/off control and scheduling. Energy-monitoring smart plugs cost about $15–25 each, according to Online Tech Tips (2026-08-23).
Energy-monitoring plugs versus control-only plugs
| Type | Energy data | Remote on/off and scheduling |
|---|---|---|
| Energy-monitoring smart plug | Real-time watts and energy use in the app | Yes |
| Control-only smart plug | None | Yes |
Some smart plugs only offer remote control. Check the listing for energy tracking before you buy.
Where plug-based monitoring falls short
- Single outlet only. Each plug reports one device. Totals for the whole home or for other circuits need a different method.
- Hardwired appliances. Equipment wired directly to a circuit cannot be measured with a plug-in meter.
- High-draw appliances. The sources do not give a load rating for plugs. Check the maximum load printed on the plug or in the manufacturer’s instructions before connecting a heater or other high-draw device.
- Estimates in the app. Cost figures are estimates based on the entered electricity rate, so compare them with your utility bill.
What can whole-home panel monitors show?
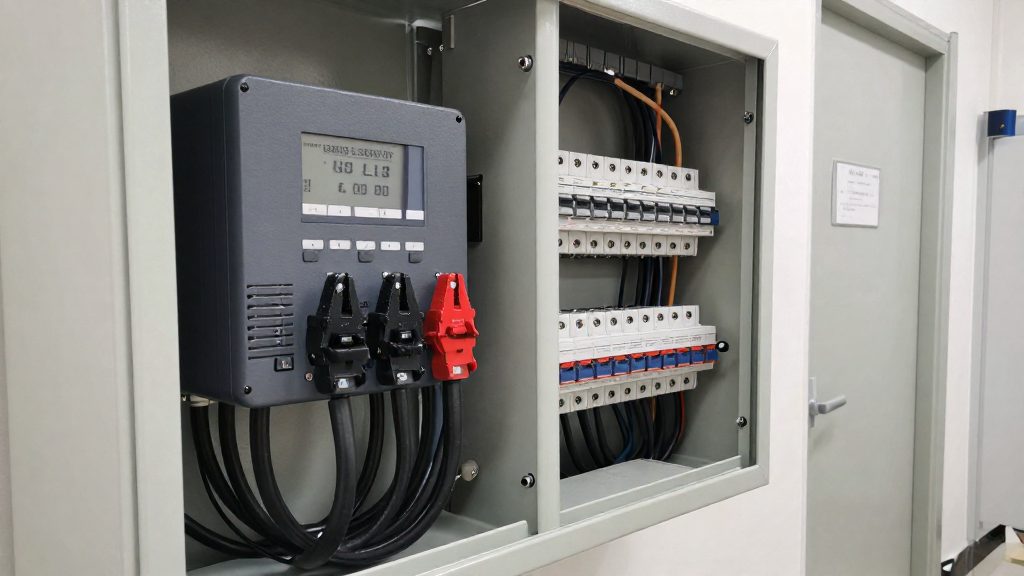
Whole-home panel monitors measure the electricity entering the house instead of one plug at a time. Their sensors are current transformers installed inside the main electrical panel. According to Online Tech Tips (2026-08-23), the hardware starts at roughly $150–200. This Old House (2026-06-02) advises that the transformers are best installed by an experienced electrician, so the total cost is higher than the hardware price alone.
Two measurement levels are typical:
- Total load. Current transformers on the two main feed wires report the combined draw of the whole home.
- Branch circuits. Smaller transformers can be placed on up to 16 branch circuits. This isolates loads such as a dryer, which can be read separately from the rest of the house.
Some systems go further and try to identify individual appliances. Sense uses machine learning to recognise the electrical signature of each device. Per Online Tech Tips (2026-08-23), it needs a few weeks to learn a home’s appliances, and smaller devices may be grouped under “Other” rather than named. Early readings during this training period should be treated as provisional.
Circuit-level monitoring without automatic identification works differently. Emporia Vue Gen 2 shows readings per circuit, and the labels are ones you set yourself, so naming circuits is the user’s task.
| Product | Monitoring level | Appliance identification |
|---|---|---|
| Sense | Whole-home load and individual devices | Automatic, using machine learning; needs a few weeks to learn |
| Emporia Vue Gen 2 | Circuit-level | None; you assign the labels |
How do energy-monitoring plugs and monitors connect to Home Assistant?
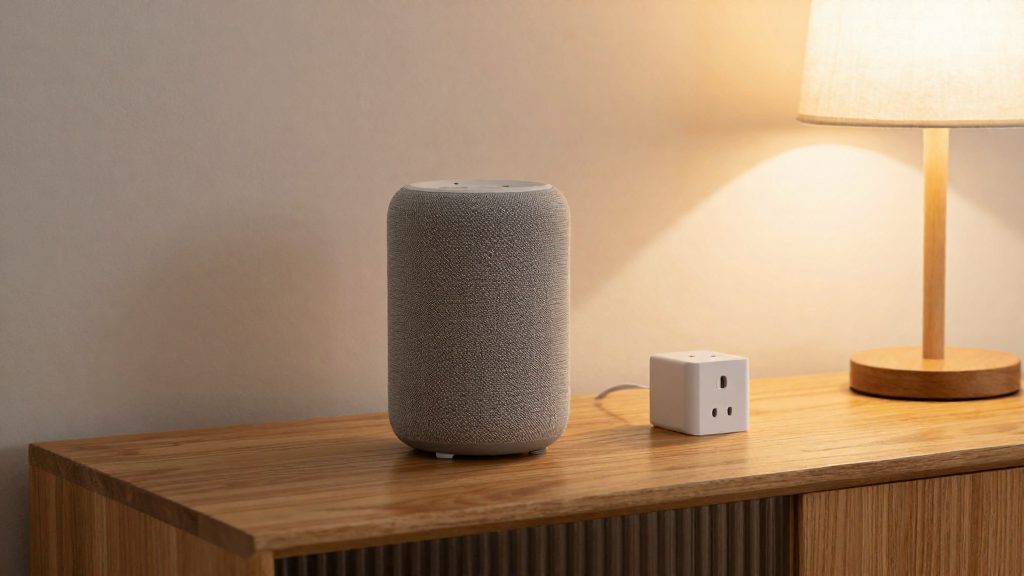
Home Assistant can track an appliance’s energy use only when the plug or monitor reports watts and kWh to it, either directly or through a bridge. Energy-monitoring smart plugs are the most direct option for a single appliance.
Protocol determines how much of that data stays under your control:
- Wi-Fi plugs connect straight to your router. Their readings usually reach the vendor’s app first, so local control in Home Assistant depends on the model’s firmware and integration support.
- Zigbee and Z-Wave devices talk to a local hub instead of the router. Home Assistant can read them through a coordinator or controller you own, which keeps traffic inside your home. Check whether a given model reports power and energy, since not every device in these families does.
- Shelly monitors paired with Home Assistant can store data locally, so they don’t rely on the cloud, according to Online Tech Tips (2026-08-23).
Once a device is integrated, Home Assistant exposes its readings as entities: an instantaneous power sensor in watts and a cumulative energy sensor in kWh. The cumulative sensor is the one to add to the Energy dashboard, because it is what allows daily, weekly and monthly totals to build up over time.
| Device type | Connection | Local data | Cost (per source) |
|---|---|---|---|
| Energy-monitoring smart plug | Wi-Fi | Depends on model and integration | About $15–25 each (Online Tech Tips, 2026-08-23) |
| Shelly monitor | Paired with Home Assistant | Stored locally | Not stated in source |
| Plug-in appliance meter | Standalone display | Not stated in source | From about $10 (This Old House, 2026-06-02) |
Check the manufacturer’s documentation for the exact entities each model creates, because the sensor names and update intervals vary between integrations.
How do you find standby power?
Standby power is the electricity a device draws while switched off or in sleep mode. It is easy to miss because it never shows up as a single event. The most reliable method is to log the device for several full days with an energy-monitoring smart plug, then separate readings taken during active use from readings taken while the device is idle. Phantom loads can come from computers, monitors, chargers, TVs, cable boxes and printers, and game consoles left in rest mode can add to them.
Multi-day logging with a plug meter
Connect the suspect device to the monitored outlet and leave it there for several days, including a weekend if its use changes then.
- Note the device’s state at the start: on, sleep, or switched off at the device.
- Leave it plugged in without changing its routine.
- Record the daily totals at the end of each day.
- Compare a day with heavy use against a day with little or no use.
If the daily total stays close to the same value on days the device was not used, that baseline is your standby load.
Hidden loads: game consoles and chargers
Game consoles can keep network features and updates running in rest mode, so they draw power after you think they are off. Chargers can keep drawing a small amount of power while they remain in the outlet, which the test below lets you confirm.
- Consoles: Compare the reading after a full power-off with the reading in rest mode.
- Chargers: Log the charger with nothing connected, then with a device connected, and then after the device is removed.
Time-of-day logs separating idle from active use
Use the time-stamped readings to match each draw to a state. Overnight and during hours when no one uses the device are the clearest windows for idle draw.
| Log pattern | What it indicates |
|---|---|
| Steady non-zero draw overnight with no use | Standby or background activity |
| Spikes during use that return to the same floor | Active load on top of a standby baseline |
| Draw drops near zero after switching off | No measurable standby draw once switched off |
| Draw unchanged after switching off | Charger or internal power supply still drawing |
To convert the idle average into a daily figure, use this formula: standby kWh per day = average idle watts × idle hours per day ÷ 1,000.
What does your utility portal tell you?
Most utility portals and apps are free and report whole-home electricity use in kWh. According to Online Tech Tips (2026-08-23), they typically show daily, weekly and monthly totals, often broken into 15-minute or hourly intervals. These views show the overall shape of your household consumption over time.
| View | What it answers |
|---|---|
| Daily kWh | How much the whole home used on each day |
| Weekly kWh | Whether use rises or falls across a week, such as during a schedule change |
| Monthly kWh | The total for billing comparison and season-to-season trends |
| 15-minute intervals | When within a day consumption peaks, at the finest resolution the portal offers |
| Hourly intervals | Daily rhythm, such as overnight baseline versus evening use |
The interval view is the most useful for pattern-finding. A baseline is the consumption that continues when people are out and most devices are idle, and a peak is a short period of higher draw. Compare a quiet overnight window with an active evening window on the same day. If the difference is large, something drawing power in the evening is the likely cause, but the portal cannot name it.
Attribution stops at the meter. The portal records one combined figure for the entire property, so an hourly spike could come from a heater, an oven, an EV charger or several devices starting together. Identifying the source requires measurement at the device or circuit level, which is covered in other sections of this guide.
Which method should you choose?
The right method depends on three things: whether you can modify the electrical installation, how much accuracy you need, and whether you want a one-time audit or continuous monitoring. Each method answers a different question, so the choice follows from the question you are trying to answer.
| Method | Approx. cost | Installation | What it shows | Best for |
|---|---|---|---|---|
| Hand calculation (watts × hours ÷ 1,000) | No hardware | None | Estimated daily and monthly kWh | Quick audit of one appliance |
| Plug-in appliance meter | From about $10 | Between appliance and outlet, no electrician | Current watts, energy over time, estimated cost | Single-appliance audit or troubleshooting |
| Smart plug with energy monitoring | About $15–25 each | Plugs into an outlet, controlled via app | Real-time energy for one device | Automations, scheduling, ongoing tracking |
| Utility portal or app | Free | None | Daily, weekly and monthly kWh, usually 15-minute or hourly intervals | Overall household pattern |
| Whole-home panel monitor | Roughly $150–200 for hardware | Current transformers in the main panel, typically by an experienced electrician | Total usage, or circuit-level data | Whole-house audit and circuit isolation |
Renters can rely on plug-in meters, smart plugs, the hand calculation and the free utility portal. None of these requires modifying the electrical panel. Panel-based monitoring depends on access to the main panel and an electrician, so it fits homeowners better.
Accuracy versus setup effort is the main trade-off. The hand calculation is the least effort but the least precise, because it relies on rated watts and estimated hours. Whole-home monitors offer the most detail. Emporia Vue Gen 2 gives circuit-level monitoring at the cost of manual labeling.
Matching the method to your goal:
- Audit: For one appliance, use the hand calculation or a plug-in meter. For the whole house, use a utility portal to establish the baseline, then a panel monitor if you need appliance-level breakdowns. Worked example: a 120 W TV used 4 hours a day uses 0.48 kWh/day, or 14.4 kWh over 30 days, which costs about $1.73 a month at $0.12/kWh.
- Troubleshooting: A plug-in meter shows live watts, so you can see whether a device draws unexpected power while running.
- Automation: Smart plugs combine energy readings with on/off control and scheduling.
Frequently asked questions
Do I need an electrician to start tracking appliance power use?
Not for the simplest option. A plug-in appliance meter sits between the appliance and the wall outlet, shows current watts, energy use over time and estimated cost, and starts at about $10 (This Old House, 2026). Installing current transformers in the main panel to monitor branch circuits is best left to an experienced electrician.
How can I estimate an appliance’s cost without a meter?
Multiply the device’s power rating in watts by its daily hours of use, then divide by 1,000 to get kWh per day. A 120 W TV used 4 hours a day uses 0.48 kWh, or 14.4 kWh over 30 days, which costs about $1.73 a month at $0.12/kWh (Direct Energy, 2026). Check the wattage on the appliance label, since the figure is a rated maximum, and the real draw will vary with settings.
Can smart power strips cut the power drawn by devices that are switched off?
Yes, smart or timed power strips can cut power to standby loads such as chargers, cable boxes and printers. Timed strips, however, can force connected devices to reboot, so check whether a device needs to stay powered before setting a schedule (This Old House, 2026).